The clock filter algorithm processes the offset and delay samples produced by the on-wire protocol for each peer process separately. It uses a sliding window of eight samples and picks out the sample with the least expected error. This page describes the algorithm design principles along with an example of typical performance.

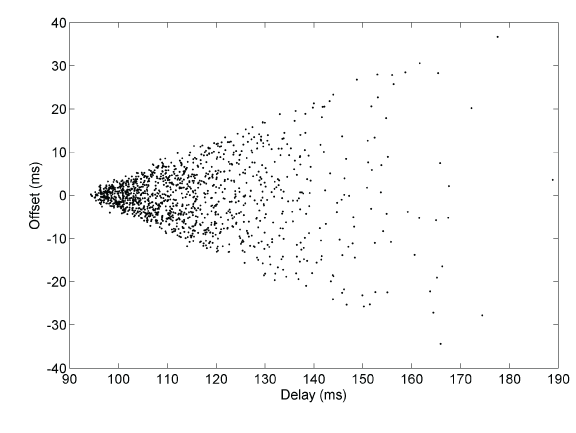
Figure 1. Wedge Scattergram
Figure 1 shows a typical wedge scattergram plotting sample points of offset versus delay collected over a 24 h period. As the delay increases, the offset variation increases, so the best samples are those at the lowest delay. There are two limb lines at slope ±0.5, representing the limits of sample variation. However, it is apparent that, if a way could be found to determine the sample of lowest delay, it would have the least offset variation and would be the best candidate to synchronize the system clock.
The clock filter algorithm works best when the delays are statistically identical in the reciprocal directions between the server and client. This is apparent in Figure 1, where the scattergram is symmetric about the x axis through the apex sample. In configurations where the delays are not reciprocal, or where the transmission delays on the two directions are traffic dependent, this may not be the case. A common case with DSL links is when downloading or uploading a large file. During the download or upload process, the delays may be significantly different resulting in large errors. However, these errors can be largely eliminated using samples near the limb lines, as described on the Huff-n'-Puff Filter page.
In the clock filter algorithm the offset and delay samples from the on-wire protocol are inserted as the youngest stage of an eight-stage shift register, thus discarding the oldest stage. Each time an NTP packet is received from a source, a dispersion sample is initialized as the sum of the precisions of the server and client. Precision is defined by the latency to read the system clock and varies from 1000 ns to 100 ns in modern machines. The dispersion sample is inserted in the shift register along with the associated offset and delay samples. Subsequently, the dispersion sample in each stage is increased at a fixed rate of 15 μs/s, representing the worst case error due to skew between the server and client clock frequencies.
In each peer process the clock filter algorithm selects the stage with the smallest delay, which generally represents the most accurate data, and it and the associated offset sample become the peer variables of the same name. The peer jitter statistic is computed as the root mean square (RMS) differences between the offset samples and the offset of the selected stage.
The peer dispersion statistic is determined as a weighted sum of the dispersion samples in the shift register. Initially, the dispersion of all shift register stages is set to a large number "infinity" equal to 16 s. The weight factor for each stage, starting from the youngest numbered i = 1, is 2-i, which means the peer dispersion is approximately 16 s.
As samples enter the register, the peer dispersion drops from 16 s to 8 s, 4 s, 2 s, and so forth. In practice, the synchronization distance, which is equal to one-half the delay plus the dispersion, falls below the select threshold of 1.5 s in about four updates. This gives some time for meaningful comparison between sources, if more than one are available. The dispersion continues to grow at the same rate as the sample dispersion. For additional information on statistical principles and performance metrics, see the Performance Metrics page.
As explained elsewhere, when a source becomes unreachable, the poll process inserts a dummy infinity sample in the shift register for each poll sent. After eight polls, the register returns to its original state.


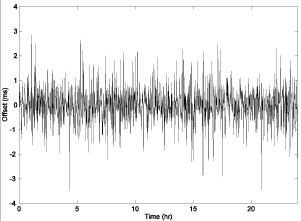
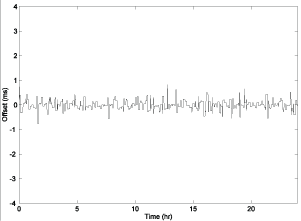
Figure 2. Raw (left) and Filtered (right) Offsets
Figure 2 shows the performance of the algorithm for a typical Internet path over a 24 h period. The graph on the left shows the raw offsets produced by the on-wired protocol, while the figure on the right shows the filtered offsets produced by the clock filter algorithm. If we consider the series formed as the absolute value of the offset samples, the mean error is defined as the mean of this series. Thus, the mean error of the raw samples is 0.724 ms, while the mean error of the filtered series is 0.192 ms. Radio engineers would interpret this as a processing gain of 11.5 dB.
The reader might notice the somewhat boxy characteristic of the filtered offsets. Once a sample is selected, it remains selected until a newer sample with lower delay is available. This commonly occurs when an older selected sample is discarded from the shift register. The reason for this is to preserve causality; that is, time always moves forward, never backward. The result can be the loss of up to seven samples in the shift register, or — more to the point — the output sample rate can never be less than one in eight input samples. The clock discipline algorithm is specifically designed to operate at this rate.